
BI as Code for Data Engineers: Faster Analytics With SQL & Markdown
Why the future of analytics is simple, portable, and written in code

Hi there! Alejandro here 😊
Subscribe if you like to read about technical data & AI learnings, deep dives!
Enjoy the reading and let me know in the comments what you think about it 👨🏻💻
📝 TL;DR
BI as Code is real and it’s getting good. Tools like Evidence.dev or Lightdash let you build entire dashboards with SQL, YAML and Markdown. No drag-and-drop, no proprietary formats.
Version control for analytics. Your dashboards live in Git alongside your dbt models. One PR can update your transformation logic AND your dashboard.
Portability beats fancy features. When your entire analytics stack is just code files, you can move it anywhere. No vendor lock-in, no export pain.
Speed comes from simplicity. Write a SQL query in a markdown file. It renders as a chart. That’s it. No abstraction layers to fight.
🎯 The Problem With Traditional BI
I’ve seen this pattern play out too many times.
Someone spins up Tableau or Power BI. They spend weeks learning the interface. They build dashboards by clicking through menus, dragging fields, configuring filters.
I even saw ninjas doing magic workarounds on Tableau sheets to show custom visuals.
Then here are all the scenarios where that can go wrong:
A column name changes in the database. Now you’re clicking through 15 dashboards to fix broken references.
Someone asks “what changed?”. Good luck figuring that out. There’s no diff, no commit history, just a screenshot someone took last month.
You need to move to a different tool. Time to rebuild everything from scratch because your dashboards are locked in proprietary format.
New team member joins. They need access, licenses, training on the specific tool, and tribal knowledge about where things live.
The bigger issue? These tools treat analytics like it’s a separate discipline from data engineering.
But here’s the thing: your data transformations are already code (dbt). Your orchestration is code (Airflow, GitHub Actions). Your quality tests are code (pytest).
Why the hell are your dashboards still point-and-click?

💡 Enter BI as Code
As someone who touched Looker Studio, Tableau, PowerBI and Metabase, I did not believe that using something as Markdown could take me to build a functioning chart.
In the era of AI, Markdown is the language of LLMs and is shaping the internet as we know it.
We can vibe code BI and that’s really powerful (and could also make BI disposable if handled the wrong way, as always)
To get familiar with the idea, I built a marketing analytics project that changed my perspective on this completely.
The stack:
PostgreSQL for raw data
dbt for transformations
Evidence.dev for dashboards
Here’s a quick walkthrough on how it looks:
The entire analytics layer is ~30 markdown files.
Each file is a page.
Each page has SQL queries embedded right in the markdown.
The queries pull from dbt models and render as interactive charts.
You get schema viewer and SQL Console to explore even more.
Here’s what a page looks like:
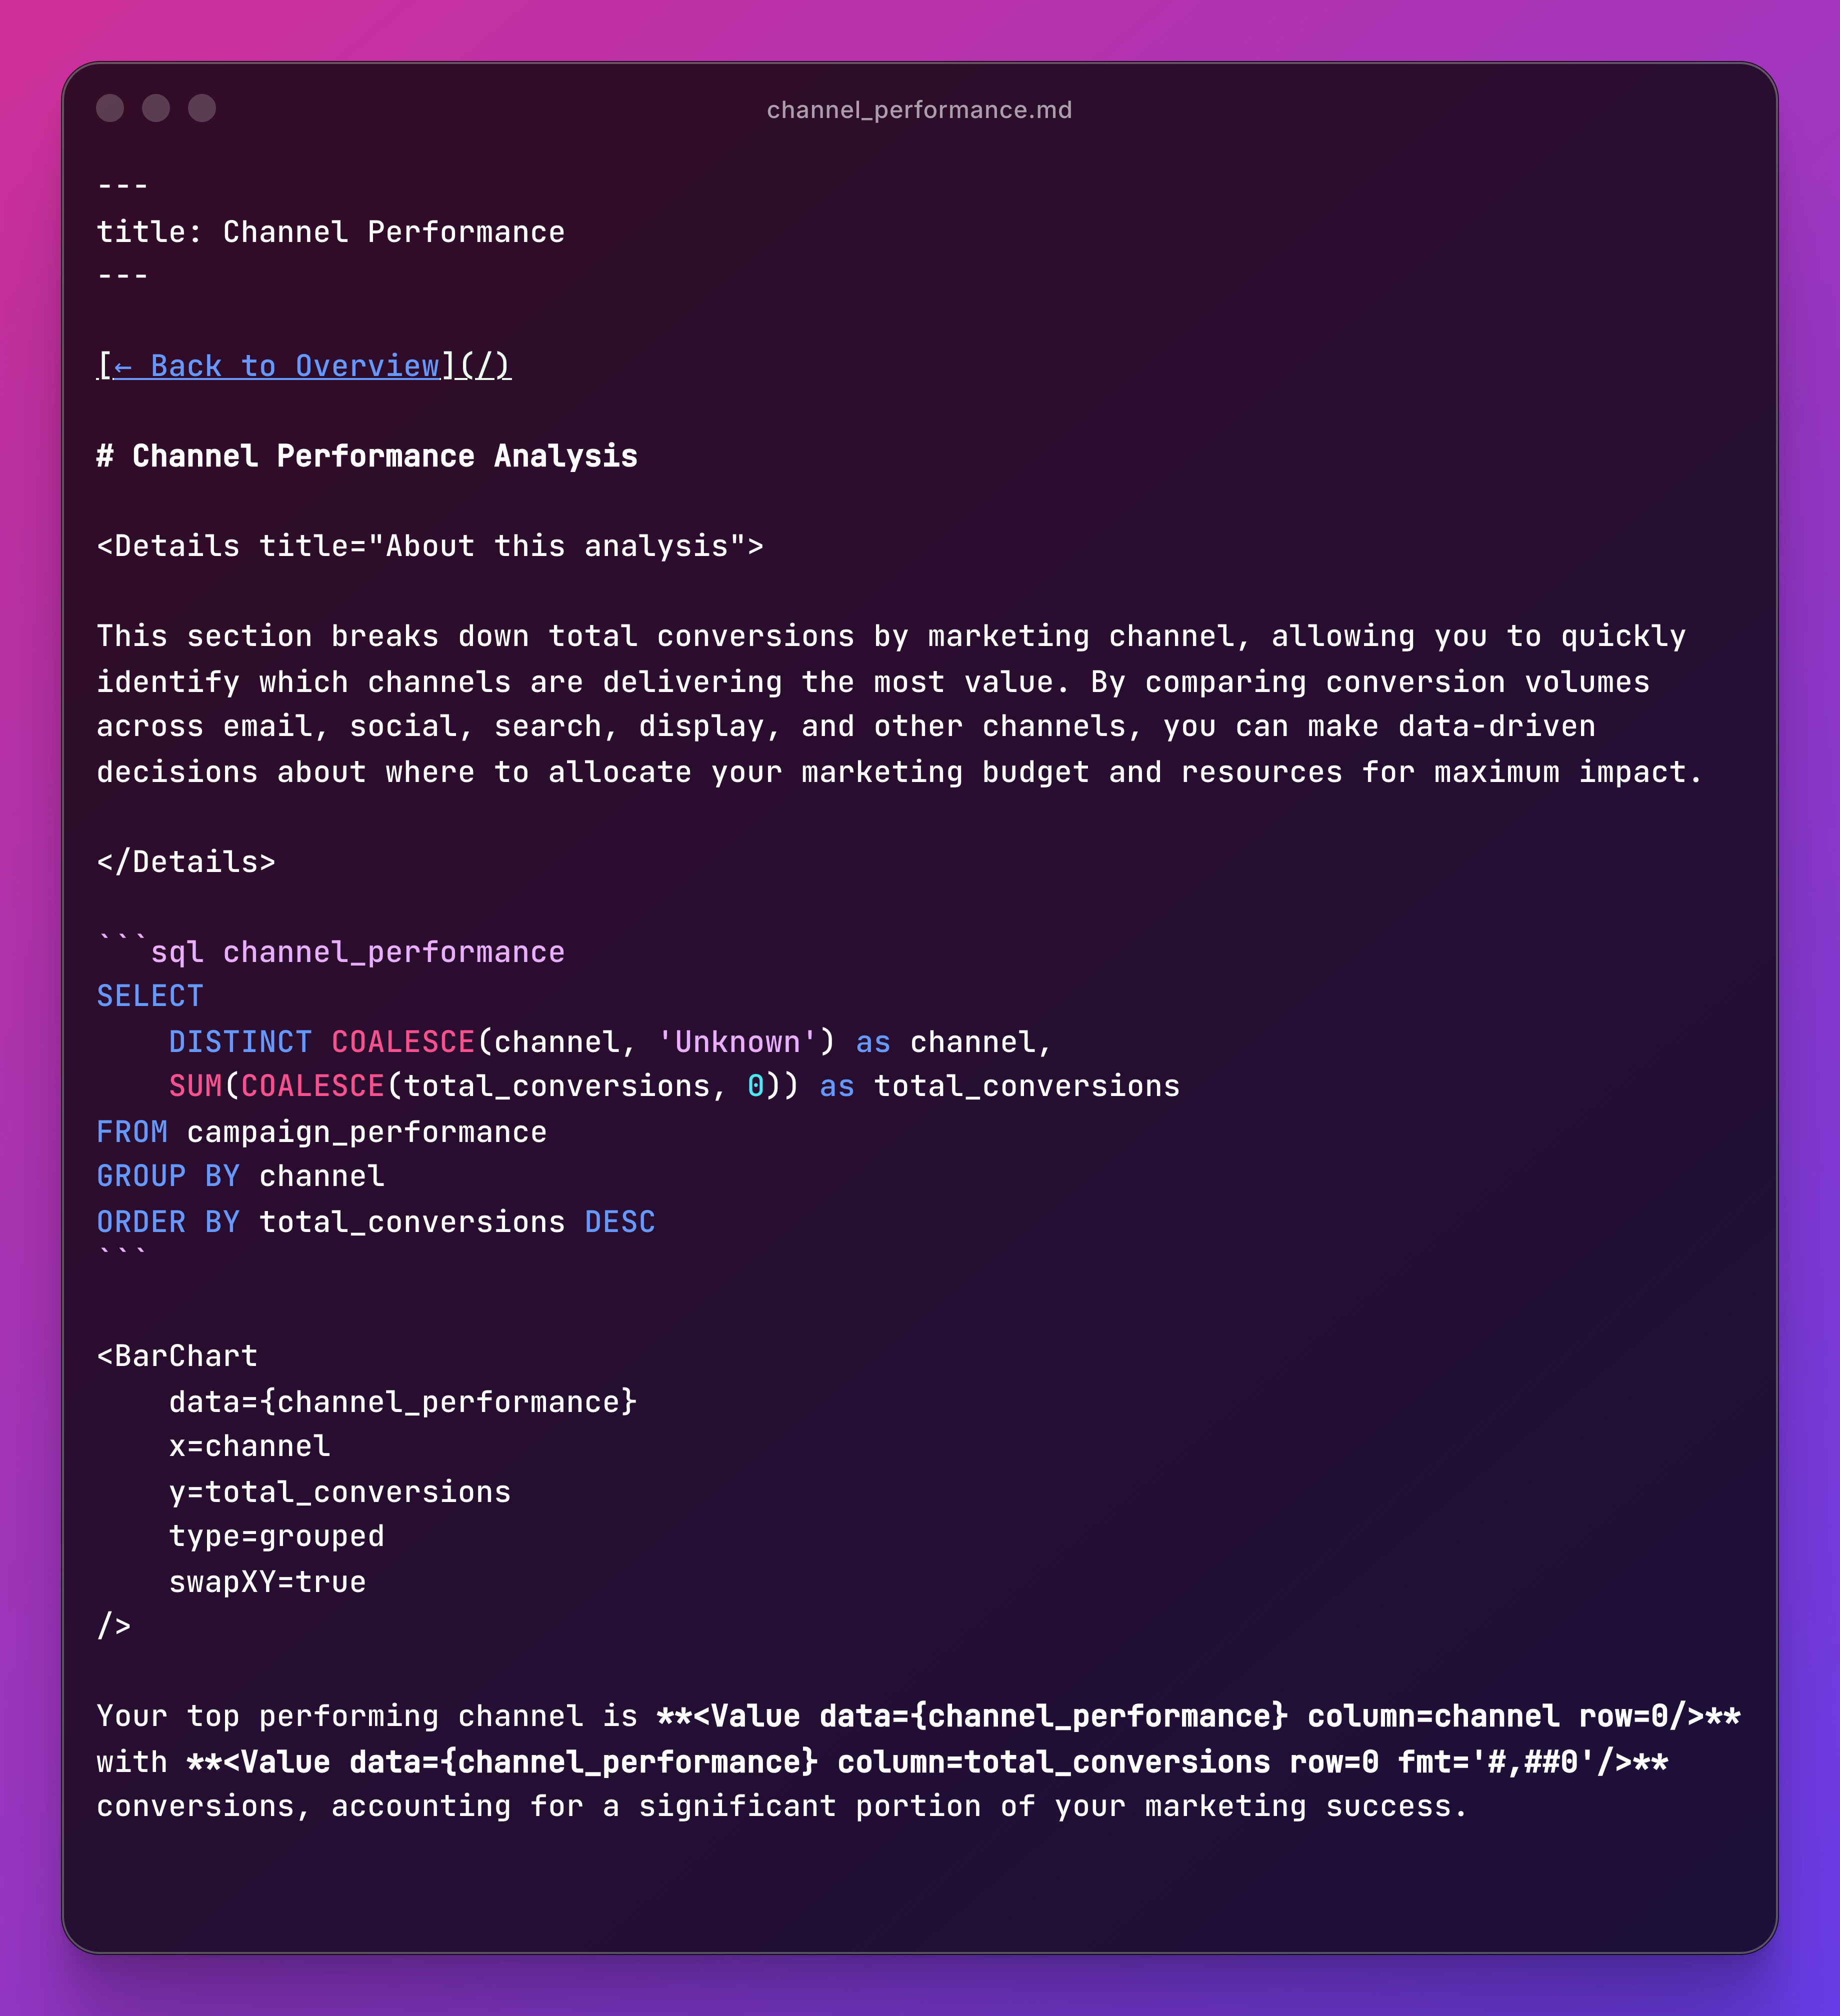
SQL query in a code block. Chart component pointing to the query results. Dynamic text pulling from the data.
That’s an entire dashboard page.
And I think that’s beautiful.
🚀 Why This Approach Actually Works
1. Version Control Is Native, Not An Afterthought
Your dashboards are just files in a repo. This means:
git diff reports/pages/channel-performance.mdYou can review dashboard updates in PRs and roll back breaking changes.
Traditional BI tools hide version control flexibility and diffs are too much to ask. If you know Git, BI As Code becomes dead easy.
2. Co-location With Your Data Models
In my project, the folder structure looks like this:
marketing-analytics/
├── dbt/
│   └── models/
│       ├── staging/
│       ├── intermediate/
│       └── marts/
└── reports/
    └── pages/
        ├── index.md
        ├── channels.md
        └── conversions.md
When you refactor a model, you update the queries in the same commit. Everything stays in sync because it’s all just code.
No more “the dashboard is broken because a column name and nobody told me.”
Note that I made this decision but is not written in stone, but considering how tools like Evidence.dev work, I would totally encourage anyone to keep your dbt project alongside your BI As Code one to keep logic aligned.
3. Deployment Is Whatever You Want
Evidence builds to static HTML. This means you can deploy it:
To Netlify or Vercel
To Github Pages
To literally any static hosting
Your analytics layer is now as portable as a blog. No vendor infrastructure. No special deployment process. Just HTML files.
4. The Learning Curve Is A Joke
If you know SQL and can write markdown, you can build dashboards.
The component library handles the UI:
<BarChart>for bar charts<LineChart>for trends<BigValue>for KPIs<DataTable>for tables
It’s our lovely SQL and components with obvious names.
In your face, Matplotlib 🤣
🤔 When BI As Code Makes Sense
You should consider this approach if:
✅ Your team already writes SQL and knows Git
✅ You want analytics version controlled with your data models
✅ You value reproducibility and portability over fancy UI
You should stick with traditional BI if:
❌ You need extremely complex interactivity (drill-through, dynamic filtering across 20 dimensions)
❌ You already have a mature BI practice with Tableau/Looker and it works fine
❌ Your org requires specific compliance features only enterprise tools provide
You need to find the right setup to avoid overkill but prevent underestimating your company BI needs.
🚀 Getting Started
If you want to try this approach:
1. Clone my demo project
The marketing analytics project shows the full pattern: dbt + PostgreSQL + Evidence. You can follow the
Github Repo - Intro To BI As Code For Data Engineers
2. Or start from scratch and check Evidence.dev Docs
npx degit evidence-dev/template my-dashboard
cd my-dashboard
npm install
npm run sources # Configure your database
npm run dev
📝 Final Words
The data stack is getting simpler.
We figured out that most teams don’t need shiny tools like Snowflake, Airflow and Spark.
Now we’re learning that most dashboards don’t need Tableau.
BI as code is the natural evolution of analytics-as-code that started with dbt. It’s treating dashboards like any other code artifact: version controlled, portable, simple.
The future of analytics is as simple as SQL files within markdown pages that do exactly what you need.
And the best thing is it can be easily powered by AI.
If you enjoyed the content, hit the like ❤️ button, share, comment, repost, and all those nice things people do when like stuff these days. Glad to know you made it to this part!

Hi, I am Alejandro Aboy. I am currently working as a Data Engineer. I started in digital marketing at 19. I gained experience in website tracking, advertising, and analytics. I also founded my agency. In 2021, I found my passion for data engineering. So, I shifted my career focus, despite lacking a CS degree. I’m now pursuing this path, leveraging my diverse experience and willingness to learn.
Evidence is one of my favorite BI tools, it makes it easy to see the underlying queries, and I really like that you can create reusable explanation templates that update alongside the data. It did have a bit of a learning curve, especially around charts and customisation, but I believe that’s improved since I last used it a year ago or so.
I’m really glad you wrote about this tool, thanks for sharing!